
通过本文主要向大家介绍了Highcharts,图表等相关知识,希望对您有所帮助,也希望大家支持linkedu.com www.linkedu.com
What is Highcharts? 下载地址 http://www.jb51.net/jiaoben/24363.html
Highcharts is a charting library written in pure JavaScript, offering an easy way of adding interactive charts to your web site or web application. Highcharts currently supports line, spline, area, areaspline, column, bar, pie and scatter chart types.
Features
It works in all modern browsers including the iPhone/iPad and Internet Explorer from version 6. Standard browsers use SVG for the graphics rendering. In Internet Explorer graphics are drawn using VML.

.
Highcharts is solely based on native browser technologies and doesn't require client side plugins like Flash or Java. Furthermore you don't need to install anything on your server. No PHP or ASP.NET. Highcharts needs only two JS files to run: The highcharts.js core and either the jQuery or the MooTools framework. One of these frameworks is most likely already in use in your web page.
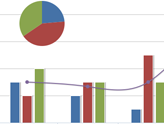
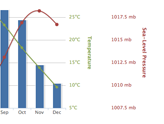
Highcharts supports line, spline, area, areaspline, column, bar, pie and scatter chart types. Any of these can be combined in one chart.
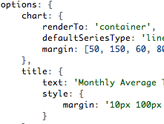
Setting the Highcharts configuration options requires no special programming skills. The options are given in a JavaScript object notation structure, which is basically a set of keys and values connected by colons, separated by commas and grouped by curly brackets.
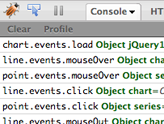
Through a full API you can add, remove and modify series, axes or points at any time after chart creation. Numerous events supply hooks for programming agains the chart. In combination with jQuery's or MooTools' Ajax API, this opens for solutions like live charts constantly updating with values from the server, user supplied data and more.
Sometimes you want to comp
Highcharts is a charting library written in pure JavaScript, offering an easy way of adding interactive charts to your web site or web application. Highcharts currently supports line, spline, area, areaspline, column, bar, pie and scatter chart types.
Features
It works in all modern browsers including the iPhone/iPad and Internet Explorer from version 6. Standard browsers use SVG for the graphics rendering. In Internet Explorer graphics are drawn using VML.
.
Highcharts is solely based on native browser technologies and doesn't require client side plugins like Flash or Java. Furthermore you don't need to install anything on your server. No PHP or ASP.NET. Highcharts needs only two JS files to run: The highcharts.js core and either the jQuery or the MooTools framework. One of these frameworks is most likely already in use in your web page.
Highcharts supports line, spline, area, areaspline, column, bar, pie and scatter chart types. Any of these can be combined in one chart.
Setting the Highcharts configuration options requires no special programming skills. The options are given in a JavaScript object notation structure, which is basically a set of keys and values connected by colons, separated by commas and grouped by curly brackets.
Through a full API you can add, remove and modify series, axes or points at any time after chart creation. Numerous events supply hooks for programming agains the chart. In combination with jQuery's or MooTools' Ajax API, this opens for solutions like live charts constantly updating with values from the server, user supplied data and more.
Sometimes you want to comp
您可能想查找下面的文章:
- jQuery插件HighCharts绘制简单2D柱状图效果示例【附demo源码】
- jQuery插件HighCharts绘制简单2D折线图效果示例【附demo源码】
- jQuery插件HighCharts绘制2D饼图效果示例【附demo源码下载】
- jQuery插件HighCharts实现的2D面积图效果示例【附demo源码下载】
- jQuery插件HighCharts实现的2D条状图效果示例【附demo源码下载】
- jQuery插件HighCharts绘制的2D堆柱状图效果示例【附demo源码下载】
- jQuery插件HighCharts实现的2D堆条状图效果示例【附demo源码下载】
- jQuery插件HighCharts实现气泡图效果示例【附demo源码】
- jQuery插件HighCharts绘制2D带有Legend的饼图效果示例【附demo源码下载】
- jQuery插件HighCharts绘制2D圆环图效果示例【附demo源码下载】