

介绍
对于绘制某些类型的数据来说,瀑布图是一种十分有用的工具。不足为奇的是,我们可以使用Pandas和matplotlib创建一个可重复的瀑布图。
在往下进行之前,我想先告诉大家我指代的是哪种类型的图表。我将建立一个维基百科文章中描述的2D瀑布图。
这种图表的一个典型的用处是显示开始值和结束值之间起“桥梁”作用的+和-的值。因为这个原因,财务人员有时会将其称为一个桥梁。跟我之前所采用的其他例子相似,这种类型的绘图在Excel中不容易生成,当然肯定有生成它的方法,但是不容易记住。
关于瀑布图需要记住的关键点是:它本质上是一个堆叠在一起的条形图,不过特殊的一点是,它有一个空白底栏,所以顶部栏会“悬浮”在空中。那么,让我们开始吧。
创建图表
首先,执行标准的输入,并确保IPython能显示matplot图。
import numpy as np
import pandas as pd
import matplotlib.pyplot as plt

%matplotlib inline
</div>
设置我们想画出瀑布图的数据,并将其加载到数据帧(DataFrame)中。
数据需要以你的起始值开始,但是你需要给出最终的总数。我们将在下面计算它。
index = ['sales','returns','credit fees','rebates','late charges','shipping']
data = {'amount': [350000,-30000,-7500,-25000,95000,-7000]}
trans = pd.DataFrame(data=data,index=index)
</div>
我使用了IPython中便捷的display函数来更简单地控制我要显示的内容。
from IPython.display import display
display(trans)
</div>
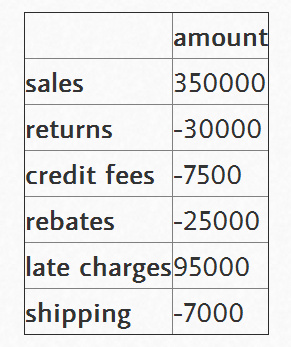
瀑布图的最大技巧是计算出底部堆叠条形图的内容。有关这一点,我从stackoverflow上的讨论中学到很多。
首先,我们得到累积和。
display(trans.amount.cumsum())
sales      350000
returns     320000
credit fees   312500
rebates     287500
late charges  382500
shipping    375500
Name: amount, dtype: int64
</div>
这看起来不错,但我们需要将一个地方的数据转移到右边。
blank=trans.amount.cumsum().shift(1).fillna(0)
display(blank)

sales        0
returns     350000
credit fees   320000
rebates     312500
late charges  287500
shipping    382500
Name: amount, dtype: float64
</div>
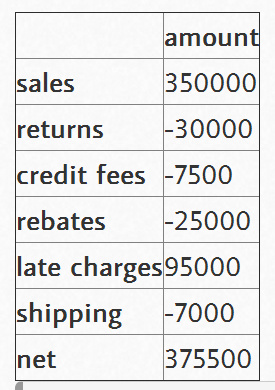
我们需要向trans和blank数据帧中添加一个净总量。
total = trans.sum().amount
trans.loc["net"] = total
blank.loc["net"] = total
display(trans)
display(blank)
</div>
sales        0
returns     350000
credit fees   320000
rebates     312500
late charges  287500
shipping    382500
net       375500
Name: amount, dtype: float64
</div>
创建我们用来显示变化的步骤。
step = blank.reset_index(drop=True).repeat(3).shift(-1)
step[1::3] = np.nan
display(step)

0     0
0    NaN
0  350000
1  350000
1    NaN
1  320000
2  320000
2    NaN
2  312500
3  312500
3    NaN
3  287500
4  287500
4    NaN
4  382500
5  382500
5    NaN
5  375500
6  375500
6    NaN
6    NaN
Name: amount, dtype: float64
</div>
对于“net”行,为了不使堆叠加倍,我们需要确保blank值为0。
blank.loc["net"] = 0</div>
然后,将其画图,看一下什么样子。
my_plot = trans.plot(kind='bar', stacked=True, bottom=blank,legend=None, title="2014 Sales Waterfall")
my_plot.plot(step.index, step.values,'k')
</div>
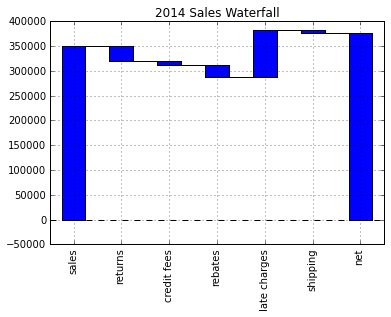
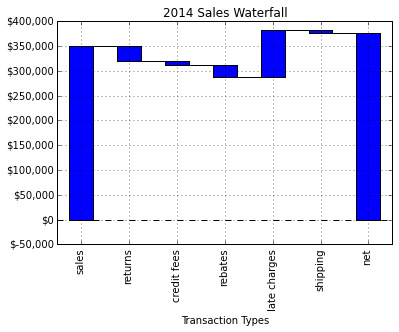
看起来相当不错,但是让我们试着格式化Y轴,以使其更具有可读性。为此,我们使用FuncFormatter和一些Python2.7+的语法来截断小数并向格式中添加一个逗号。
def money(x, pos):
  'The two args are the value and tick position'
  return "${:,.0f}".format(x)

from matplotlib.ticker import FuncFormatter
formatter = FuncFormatter(money)
</div>
然后,将其组合在一起。
my_plot = trans.plot(kind='bar', stacked=True, bottom=blank,legend=None, title="2014 Sales Waterfall")
my_plot.plot(step.index, step.values,'k')
my_plot.set_xlabel("Transaction Types")
my_plot.yaxis.set_major_formatter(formatter)
</div>
完整脚本
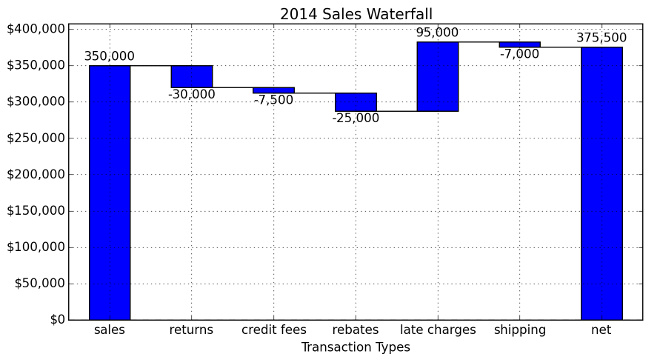
基本图形能够正常工作,但是我想添加一些标签,并做一些小的格式修改。下面是我最终的脚本:
import numpy as np
import pandas as pd
import matplotlib.pyplot as plt
from matplotlib.ticker import FuncFormatter

#Use python 2.7+ syntax to format currency
def money(x, pos):
  'The two args are the value and tick position'
  return "${:,.0f}".format(x)
formatter = FuncFormatter(money)

#Data to plot. Do not include a total, it will be calculated
index = ['sales','returns','credit fees','rebates','late charges','shipping']
data = {'amount': [350000,-30000,-7500,-25000,95000,-7000]}

#Store data and create a blank series to use for the waterfall
trans = pd.DataFrame(data=data,index=index)
blank = trans.amount.cumsum().shift(1).fillna(0)

#Get the net total number for the final element in the waterfall
total = trans.sum().amount
trans.loc["net"]= total
blank.loc["net"] = total

#The steps graphically show the levels as well as used for label placement
step = blank.reset_index(drop=True).repeat(3).shift(-1)
step[1::3] = np.nan

#When plotting the last element, we want to show the full bar,
#Set the blank to 0
blank.loc["net"] = 0

#Plot and label
my_plot = trans.plot(kind='bar', stacked=True, bottom=blank,legend=None, figsize=(10, 5), title="2014 Sales Waterfall")
my_plot.plot(step.index, step.values,'k')
my_plot.set_xlabel("Transaction Types")

#Format the axis for dollars
my_plot.yaxis.set_major_formatter(formatter)

#Get the y-axis position for the labels
y_height = trans.amount.cumsum().shift(1).fillna(0)

#Get an offset so labels don't sit right on top of the bar
max = trans.max()
neg_offset = max / 25
pos_offset = max / 50
plot_offset = int(max / 15)

#Start label loop
loop = 0
for index, row in trans.iterrows():
  # For the last item in the list, we don't want to double count
  if row['amount'] == total:
    y = y_height[loop]
  else:
    y = y_height[loop] + row['amount']
  # Determine if we want a neg or pos offset
  if row['amount'] > 0:
    y += pos_offset
  else:
    y -= neg_offset
  my_plot.annotate("{:,.0f}".format(row['amount']),(loop,y),ha="center")
  loop+=1

#Scale up the y axis so there is room for the labels
my_plot.set_ylim(0,blank.max()+int(plot_offset))
#Rotate the labels
my_plot.set_xticklabels(trans.index,rotation=0)
my_plot.get_figure().savefig("waterfall.png",dpi=200,bbox_inches='tight')
</div>
运行该脚本将生成下面这个漂亮的图表:
最后的想法
如果你之前不熟悉瀑布图,希望这个示例能够向你展示它到底是多么有用。我想,可能一些人会觉得对于一个图表来说需要这么多的脚